Monday, March 31, 2014

KOSPI 200 data feed fixed

The K200 data feed problem from Interactive Brokers (IB) is finally fixed today, after 6 trading days of downtime.  While I do get the bar/data for today, 1-Apr-2014, I do not get the bar/data for the previous 6 trading days.  See below.


Will IB correct the data for the past 6 trading days?  We shall see.


KOSPI 200 (K200) Daily updates

The K200 data problem in Interactive Brokers (IB) that I reported in this post is still not fixed.  I no choice but to capture the Daily Closing Index from Korea Stock Exchange here.

K200 Close at 258.11 today, 31-Mar-2014.

K200 has been going up steady over the past week, gaining almost 7 points.  Including today move, it is about 7.5 points up since the last low at 250.68 on 21-Mar-2014.


On a 3 Month chart, we can see that it is approaching the previous high, also a resistance, at 258.


Sunday, March 30, 2014

Nikkei Stock Average Volatility Index

As written in previous post, I was looking for VIX equivalent for Nikkei 225 (N225) and KOSPI 200.  I am glad that I found VIX equivalent for N225 : Nikkei Stock Average Volatility Index (NKVI) at here.

The below overview is quoted from the website.  I have not studied in detail its guidebook or fact sheet.  At the mean time, I will interpret it the same as VIX.

Overview
The Nikkei Stock Average Volatility Index indicates the expected degree of fluctuation of the Nikkei stock Average in the future. The greater the index values are, the larger fluctuation investors expect in the market.


  • (Underlying index) The Nikkei Stock Average Volatility Index signals the expected volatility of the Nikkei 225 in one month period.
  • (Calculation method) The Nikkei Stock Average Volatility Index are calculated by using prices of Nikkei 225 futures and Nikkei 225 options on the Osaka Securities Exchange. In the calculation, taking near-term future price as the basis of ATM, the volatility of near-term option and next-term option are calculated with OTM option prices of each delivery month. Then, the index value is calculated by linear interpolation or linear extrapolation between the volatilities of each delivery month to make the time to expiration as 30 days.
  • (Base date) The commencement date of the calculation was November 19, 2010, which had been retroactively calculated in the past on the end-of-day basis, to Jun 11th, 1989. The index is currently calculated every 15 seconds during the day session of the Nikkei 225 options on the OSE.
Looking the 1 year chart, it seems that NKVI usual range is between 20-30, with spike to 40+ in the month of May-June.
NKVI 1 year


The 3 months chart show that it stay between 20-30 most of the time, except with a spike to 30+ in Feb.
NKVI 3 months

The 1 week shows that NKVI close at 23.71 lowest in the week.  So, not a good time to sell options?  
NKVI 1 week


I will take some time to study NKVI with N225 to have a better understanding on the correlation before I update my Money Management rules in the Trading Plan.

Thursday, March 27, 2014

Interactive Brokers KOSPI 200 data feed is down

There is no data feed for KOSPI 200 (K200) since Monday, 24-Mar-14, when I reported the problem to Interactive Brokers (IB).  Last bar on K200 chart is Friday, 21-Mar-14.


Today is Thursday.  The problem is still not fixed.  Very disappointed with IB!

I have to refer to Korea Stock Exchange (KRX) repeatedly to check the K200 movement.  This is 27-Mar-14 close taken from KRX here.

KOSPI 200 27-Mar-14


Monday, March 24, 2014

Money Management Rules

I took the below Money Management Rules from Options Trading IQ Sample Iron Condor Trading Plan.  You need to register/sign up to get the access to the Free Tools/Resource page.

I have made some modification, to be bit aggressive in utilizing the capital for trading.  Not as aggressive as Karen the super trader (she uses up to 70%).


I have not found the VIX equivalent for N225 and K200.  As most of the indices are affected by the SPX (most of the time), I will use VIX as a guide for the time being.


Sunday, March 23, 2014

Quadruple Witching

I wrote about the SPX Settlement Risk, not realising that it happens to be the Quadruple Witching.

The third Friday of March, June, September and December when Index Futures, Options on Index Futures, Single Stock Futures and Stock Options expired.

This often resulted in higher volatility (price will move up/down in a bigger move), as can be seen in SPX first 5 min trading on 21-Mar-14.  SPX gap up about 25 points and move down 15 points all within the 5 minutes of trading.


Friday, March 21, 2014

SPX Settlement Risk

SPX close at 1872.01 on Thursday, 20-Mar-14.


If you have a Short Call at 1885 or 1890 with ProbITM of 5.68% and 2.23% respectively (Delta of 0.06 and 0.02 respectively), you would have thought it was quite safe that your Short Call will not be hit or exercised.


However, SPX Settlement Value (SET) is 1893.30 on Friday, 21-Mar-14, despite SPX close at 1866.52.


Both Calls Strike price of 1885 and 1890 are all hit!  Your Call option contracts didn't expire worthless as expected.  They will be exercised!

This is a good real life illustration of Settlement Risk.  To avoid such Settlement Risk, we need to have 50+ points cushion between SPX price and short options's strikes.  Or simply close the position before expiration.  The last few pennies is just not worth the risk.


SPX Contract Spec

Expiration Date:
Saturday immediately following the third Friday of the expiration month until February 15, 2015. On and after February 15, 2015, the expiration date will be the third Friday of the expiration month.

Last Trading Day:
Trading in SPX options will ordinarily cease on the business day (usually a Thursday) preceding the day on which the exercise-settlement value is calculated.

Settlement Value:
Exercise will result in delivery of cash on the business day following expiration. The exercise-settlement value, SET, is calculated using the opening sales price in the primary market of each component security on the last business day (usually a Friday) before the expiration date. The exercise-settlement amount is equal to the difference between the exercise-settlement value and the exercise price of the option, multiplied by $100.


Tuesday, March 18, 2014

Difficulty In Trading Combo Order for K200 and N225

There is one big Order Execution difficulty in trading Combo Order in K200 and N225 using Interactive Brokers.

The 2-legs combo trade (Spread trade) is non-guarantee.  The 4-legs (Iron Condo) is not possible.  I didn't feel so bad until I started trading RUT.  Not only 2-legs combo in RUT are guarantee, so is 4-legs combo trade in RUT.

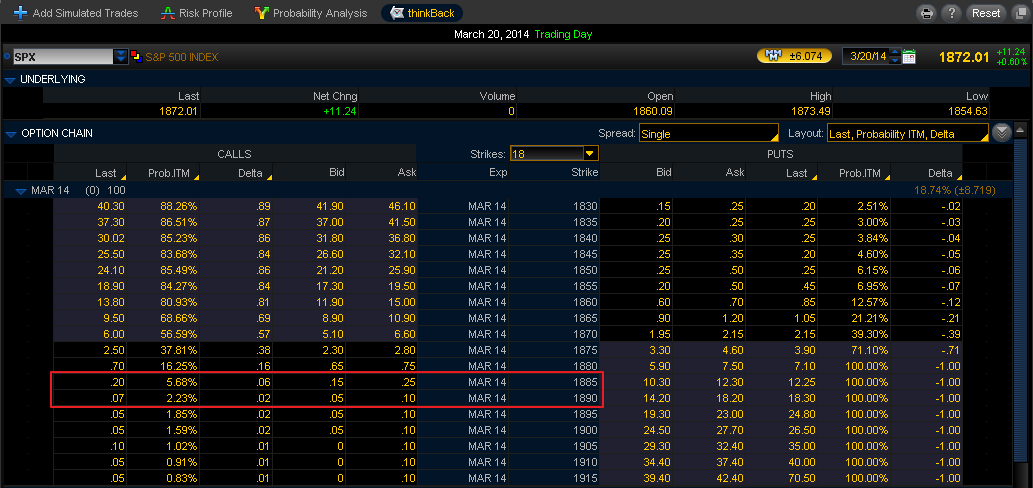
This becomes very frustrated and difficult when you want to close your Iron Condo or Vertical Spread that is only a few pennies. Assuming you have a sold a Call Bear Spread 267.5/270 (ie, Sold 267.5 & Bought 270), you want to close it by buying it back (ie Buy 267.5 & Sell 270).


You can see the spread is having a Bid/Ask spread of -0.03/-0.01 (above table).  If you submit a bid of -0.02 (mid-point), you will never see it jump in the queue.  That is to say, you will never see the Spread Bid/Ask narrow to -0.02/-0.01.  In order to guarantee your spread got filled, you got no choice but to buy back at the higher price -0.03.

Another way is to trade single leg separately, ie:  Buy 267.5 Call and Sell 270 Call.  So, you queue to buy 267.5 Call at 0.05 and Sell 270 Call at 0.04.

Best scenario: If both got filled, you got the best deal at closing the spread at -0.01.  This is very unlikely as the bid/ask size is usually very big when the option is only a few pennies.

Worst scenario: Say, the Sell 270 Call got filled at 0.04, the 267.5 Call price rallied to bid/ask of 0.07/0.08 or higher.  Firstly, your margin jump up immediately because your Long 270 Call contract in your spread is sold, leaving you having a naked Short contract 267.5 Call.  You have to quickly close this naked Short contract by buying 267.5 Call at 0.08.  You close the spread at -0.04, higher than simply buy at the market then.

Likely scenario: Say, the Sell 270 Call got filled at 0.04, you immediately buy 267.5 Call at the Ask price of 0.06.  You close the spread at -0.02, at mid price of the original spread bid/ask price.

Trading single leg separately is possible, not without risk.  And you need to stare at the screen when order got executed, else high chance you will end up in worst scenario.  Most of the time, I will just buy at the higher price spread to close it immediately, losing out to the bid/ask spread.

If there is any other broker that can offer guarantee combo trade (2-legs or even better, 4-legs) for K200 and N225, please let me know.  Thanks in advance.


Interactive Brokers Note on pricing: 
If you buy a spread and you owe cash (debit spread), enter a positive limit price. If you buy a spread and you receive cash (a credit spread), you must enter a negative limit price. Conversely, if you sell a spread and receive cash, enter a positive limit price. If you sell a spread and owe cash, you must enter a negative limit price.
For example, an April 20.0 xyz call shows a BID price of 6.60 and an ASK price of 6.70. An April 30 xyz call shows a BID price of 0.15 and an ASK price of 0.20.

If you buy a "debit" call vertical spread with the following legs:
Buy 1 OPT APR02 20.0 CALL (6.70),
Sell 1 OPT APR02 30.0 CALL (0.15)
For this transaction you pay: 6.55 (a debit transaction)

If you invert the legs and buy a "credit" call vertical spread with the following legs:
Sell 1 OPT APR02 20.0 CALL (6.60)
Buy 1 OPT APR02 30.0 CALL (0.20)
For this transaction you receive 6.40 (a credit transaction, enter a negative price)

But for RUT, I can see it immediately.


When do I need to consider Currency Hedging

With all the income/profit coming as KRW and JPY, when do I need to consider currency hedging?

I couldn't find any rule of thumb to guide me.  I probably should not spend time and cost performing currency hedging when the currency exposure is less than SGD 100,000.

At the mean time, I should probably just performing a monthly conversion to SGD.

Korean Won (KRW)
For KRW, it is not so straight forward.  There is no direct conversion between KRW and SGD.  I have two options:
1) KRW.JPY, then SGD.JPY
2) KRW.USD, then USD.SGD

Since USD has a tighter spread, I should use the second option.

Japanese Yen (JPY)
For JPY, it is simple, there is a SGD.JPY for conversion.


A Good Trade That Went Wrong?

Is this a good trade that went wrong?

Day 1: 12-Mar-2014 N225 : 14853 (-370 or -2.43%)

I have been waiting for this big drop (>2% drop) for many days/weeks.  Implied Volatility (IV) has shot up (somehow I didn't capture all the IV.  will need to find out where else I can get it).  I immediately sold a Iron Condor with good credit of 40 points.


Implied Volatility :
Iron Condor (40 credit : JPY 400,000, ROM 53%)
10 N225 16000/16250 Bear Call Spread (Delta 11.43/7.23) : 20
10 N225 13500/13250 Bull Put Spread (Delta 12.80/9.47) : 20


Day 2: 13-Mar-2014 N225 : 14816 (-13.74 or -0.09%)


Implied Volatility :
Iron Condor (46 credit) : Loss of 6 pt (JPY 60,000)
10 N225 16000/16250 Bear Call Spread (Delta 10.89/6.85) : 23
10 N225 13500/13250 Bull Put Spread (Delta 11.65/8.51) : 23


Day 3: 13-Mar-2014 N225 : 14327.18 (-488.80 or -3.30%)


Implied Volatility :
Iron Condor (53 credit) : Loss of 13 pt (JPY 130,000)
10 N225 16000/16250 Bear Call Spread (Delta 4.53/2.80) : 8
10 N225 13500/13250 Bull Put Spread (Delta 24.94/19.16) : 45

The drop of 488.80 points (or 3.30%) is making this Iron Condor very uncomfortable.  Delta is almost 25, which is my adjustment trigger point (Don't let Deltas go over 25 to 30).  And N225 is only 827 points away from the Short Put Strike of 13500.


Day 4: 17-Mar-2014 N225 : 14277.52 (-50.14 or -0.35%)


Implied Volatility :
Iron Condor (48 credit) : Loss of 8 pt (JPY 80,000)
10 N225 16000/16250 Bear Call Spread (Delta 3.97/2.49) : 8
10 N225 13500/13250 Bull Put Spread (Delta 24.65/18.20) : 40

I decided to adjust : taking the 8pt loss and open a new Iron Condor.

Iron Condor (34 credit : JPY 340,000, ROM 45%)
10 N225 15500/15750 Bear Call Spread (Delta 10.18/6.44) : 17
10 N225 12750/12500 Bull Put Spread (Delta 10.02/7.38) : 17

Day 5: 18-Mar-2014 N225 : 14409.43 (+131.76 or 0.92%)


Did I adjust too early?


Monday, March 17, 2014

K200 limited Strike Price a problem

The limited number of available Strike Price in K200 is a major problem to trade Iron Condor out-of-the-money.  It will be difficult to perform adjustment such as rolling out.

The K200 Options Specification says "Upon the admission of the options, at least 13 strike prices(six are in-the-money, one is at-the-money and six are out-of-the-money) shall be set at interval of 2.5 points for the three consecutive near-term month contracts".


Refer the the Option Chain as 17-Mar-2014 above.  There are only six out-of-the-money Strike Price for Put Options in May contracts.  There is no Delta 10 (-0.1000) or lower contract.  The lowest you get is 16 (-0.1615).

So, to trade Iron Condor for May contract, one may need to legging, start selling Call Spread first, then sell Put Spread when it is available.

Friday, March 14, 2014

I received an assignment notice for Nikkei 225 Option

Today I received an assignment notice from my broker that my short option contract on Nikkei 225 (N225) which expired yesterday, 13-Mar-2014.

Was I surprised?  Yes and No.

Yes because N225 is a cash settlement option.  So, I should not be 'assigned' to buy the Nikkei Index component stocks.  After I clarified with the broker, I need not take any action.

No because while N225 close at 14,815.98 on 13-Mar-2014 Japan time, which is about 300+ points above my Strike of 14,500,

N225 Daily as at 13-Mar-2014
N225 Daily


SPX Daily as at 13-Mar-2014
SPX Daily
SPX close 21.86 point down on 13-Mar-2014 US time.  So, N225 should 'crash' more than 300+ points when N225 open for trading on 14-Mar-2014 Japan time.  There is a high chance that it will hit my Strike.

For most Index options, the settlement price is the opening price on the business day following the last trading day.  N225 final settlement price is 14,429.87 (Special Quotations) on 14-Mar-2014.  70.13 points below by Strike of 14,500.  I suffered a loss of JPY 70,130 or USD 689.10 for this contract.

On the expiration day, 13-Mar-2014, I can close this N225 Mar13'14 14500/14250 Put Spread for a profit of JPY 8,600 (~USD 83.94) with a 8 Days on Trade, 11% Return on Margin (ROM).  With the full Iron Condor (including 15750/16000 Call Spread), it will be JPY 36,200 (~USD 353.34), 48% Return on Margin with a 8 Days on Trade.

I didn't.  Because it was the expiration day.  Because delta is only -0.0548.  These are good reasons to stay in the trade.

But not good enough when N225 is just 300+ away from my Short Strike.  A down day for N225 could be easily 300-500 points.

Worst still, when we are talking about a spread of 4 points, JPY 4,200 (~USD 41.27) reward that we are taking the risk.

Mark Wolfinger of "The Rookie's Guide to Options" advice not to risk another day (even on the expiration day) for a penny even when your Strike is quite far away.  You don't know what will happen tomorrow.  Michael Benlifa in his book "Profiting with Iron Condor Options" also advice to take profit when it reach your targeted ROM.

A good lesson learned.  A good experience of being assigned.  A good understanding of it is the next day opening price that matters for Index Options.


Tuesday, March 4, 2014

Trading Options At Expiration

Read the book "Trading Options At Expiration" by Jeff Augen.  In this book,  Jeff discussed the three major forces that happens during Expiration day:

  • Implied Volatility collapse
  • Strike Price pinning effects
  • Rapidly accelerating Time Decay
This is a totally new concept for me as it involves trading option on that single day.  That is a Day Trading options.  I am not ready to day trading options.  Making a note here to revisit at later time.