Saturday, June 28, 2014

Weekly Market Reivew K200

K200 closed at 258.78 on Friday, 27-Jun-2014, gained 3.47 (1.36%) over the last 5 trading days.

This week gain is about the same as last week drop. The big drop we used to get in past weeks seem to stop.  We see more pushing up instead.  However, K200 didn't manage to push past previous high of 260.74.


Looking at bigger picture, it seems that K200 retracement to 76.40%-100% might have stopped. If it breaks previous high and give a higher low, the uptrend is resumed.  We will do some Fibo projection of how high it will climb.   At the mean time, let's see.


Weekly Market Reivew N225

N225 closed at 15,095.00 on Friday, 27-Jun-2014, lost 254.42 (1.66%) over the last 5 days.  NKVI moved down 0.11 (0.63%) ending the week at 17.33

This week drop is about the same as last week gain.  In fact, most of the lost was contributed by Friday drop.  We will need to see if N225 holds above 15,000 and the previous low of 14830.99 to determine if the uptrend has paused/reversed.


On the Weekly chart, although it was a bearish bar, N225 is still on an uptrend.


NKVI continues to move down.  In fact, the Thursday low of 16.31 is almost the lowest since 4-Jan-2011 (the earliest date available from http://indexes.nikkei.co.jp/en/nkave/index/profile?cid=6&idx=nk225vi), with only 3 days lower than 16.31.
Will it revert to mean?  How low can it go?


SPX closed at 1968.17, 3.74 points on Friday.


Saturday, June 21, 2014

Weekly Market Reivew K200

K200 closed at 255.31 on Friday, 20-Jun-2014, lost 3.44 (1.33%) over the last 5 trading days, mainly from the large down of 3.52 on Friday.


In the last two weeks, every big drop came with a small rally/retracement but ended with lower high.  And every drop ended with lower low.  So, K200 is in a short term downtrend, ignoring all the record high in S&P, DOW, etc.


However, looking at the bigger picture.  K200 is in its retracement of a uptrend.  Looking at its previous few retracement, it had been in the range of 76.40%-100% retracement.  K200 could be another 1-2 points down to about 253.35 before it resume its uptrend.  Let's see.


Weekly Market Reivew N225

I didn't do the last week review because I was on 4 days vacation from last Sunday.  Let's continue this week.

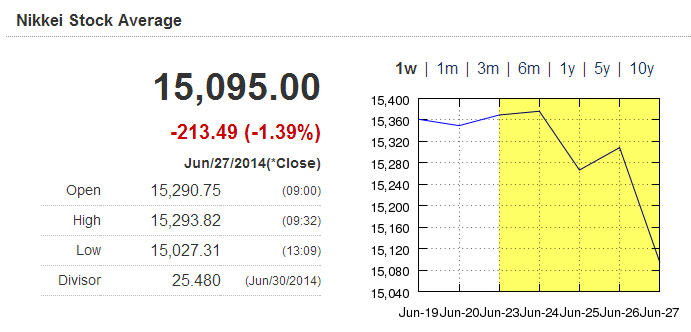
N225 closed at 15,349.42 on Friday, 20-Jun-2014, gained 251.58 (1.67%) over the last 5 days.  NKVI moved down 2.22 (11.29%) ending the week at 17.44.


In the last two weeks, N225 dipped below 15,000 for a few times on the Daily chart.


However, on the Weekly chart, N225 has defended well.  It rejected 15,000 strong in both weeks.


In my last review, I mentioned that N225 should be able to break its previous high at 15312,60.  It didn't make it last week but it made it this week.  The next number we should be looking at will be around 15,800.


I stop writing about NKVI in the last review.  But I am bringing it back because of the alarming low volatility.
NKVI has never been so low for a long long time.  The only period that has NKVI lower than 17.44 is Oct-Dec 2012 and Jan-Feb 2011 (source : http://indexes.nikkei.co.jp/en/nkave/index/profile?cid=6&idx=nk225vi).


I cannot find a market data source that I can plot both N225 and NKVI together, yet.  I will use Interactive Broker for the time being.  I don't trust IB's data (as mentioned in this post).  And IB NKVI data is only back up to Mar 2012.

Anyhow, as you can see from the below IB chart, the Oct-Dec 2012 period is the period before N225 has its historical climb from around 8,500 to around 16,000 from Nov 2012 to May 2013!


If you refer to the Daily Chart below, the climb is with very few pull back.  Such environment is very difficult to trade selling option, especially Iron Condor.  It will creep slowly towards your short strike of the call side.  With volatility so low, the typical methods of rolling up and / or out are unattractive or not possible.  In fact, the rolling up or out will again get hit pretty soon.


I will do a more detail analysis using more reliable data source and chart in the coming weeks.  This is getting me uneasy.

SPX closed at 1963.91, record high again, up 3.39 points on Friday.  This would likely push N225 higher on Monday.


Monday, June 9, 2014

Exit Strategy

When I first started selling options, I only hold till expiration.  I was lucky that most of the trades expired worthless.  I was also 'fortunate' to receive the assignment notice in my early trading days, which I described in this post.

After more reading and more experience selling options, my exit strategy has changed.  The book that influences me most is "Profiting with Iron Condor Options", by Michael Benlifa.

Assuming that the Iron Condor was sold for 17% credit base on margin require, ie 17% Return On Margin (ROM).  Say, it is $170 credit on $1000 margin.
Chart from "Profiting with Iron Condor Options", by Michael Benlifa.

The option expire in 72 days.  Base on the theoretical yield curve (assuming everything remains the same), you can forecast your P&L from the day of your trade till expiration.

After 18 days, you will be able to keep 5% (ie $50) out of the 17%.  This represent 29% of the total credit.  You have still 54 days to expiration.  Those 18 days represent only 25% of the total length of the contract (72 days).

If you wait 36 days, you could keep 12% (ie $120) out of the 17%.  This represent 71% of the total credit and 50% of the total length of the contract (72 days).

You could decide to wait the entire 72 days with the idea of keeping the entire credit (i.e. $170).
Chart from "Profiting with Iron Condor Options", by Michael Benlifa.

As you can see from the above Time risk versus reward chart, the best risk/reward ratio is 50% of the total length of the contract (72 days).

Michael explains that it may not worth to chase for the remain 29% (i.e. $50) by staying in the market for another 36 days.  Things may go wrong.  The wining trade can start to lose money. 

He also explains that if you are content with 5% ROM (which is good by anybody's standard), don't take the risk for another 54 days.

Thanks for his insight, my exit strategy has changed.  I usually take profit when I have >70% credit.  I don't hold the option till expiration anymore.

I may not explain his concept very well.  Go read the book.  It has many good ideas, concept.  Although it is a small book (can finish in 1 day), but I keep going back for reference, for ideas.


Saturday, June 7, 2014

Weekly Market Reivew K200

K200 closed at 260.56 on Thursday, 5-Jun-2014, gained 0.62 (0.24%) over the last 3 trading days (Wednesday and Friday is Korea holiday), swing up and down in a tight 3 points range.


Not much has changed this week from last week.  K200 is still undecided where to go.  However, the strong S&P 500 didn't help K200 to move up could be an indication that K200 is quite weak.  Any bad news may bring it down fast.


Weekly Market Reivew N225

N225 closed at 15,077.24 on Friday, 6-Jun-2014, gained 444.86 (3.04%) over the last 5 days.  NKVI moved up 0.41 (2.08%) ending the week at 20.16.


The two jumps on Monday and Tuesday, propel N225 to be above 15,000.  Thereafter, N225 was defending 15,000.  And it was successful.


In fact, N225 was trying to challenge the previous high at 15,164.39.  Friday high of 15,144.34 is just a mere 20 points away.  With another record high by S&P 500 on Friday, we could see N225 break the previous high on Monday.  And maybe the previous previous high at 15312.60.


I will stop writing about NKVI as there is nothing to write about the past many weeks.  It has been on the low for a long time.  I do not know how to use this info to trade.  Or to say another way, I don't find NKVI info useful in my trading, for now.


SPX closed at 1949.44, record high, up 8.98 points on Friday.  This would likely push N225 above 15,164.39 or 15312.60, the last two previous high, on Monday.