Thursday, July 31, 2014

K200 added new strikes

K200 added 2 new Strikes (282.5 and 285) for both Sep11'14 and Oct08'14.  However, there is still no price quoted for Call 285 for both Sep11'14 and Oct08'14.


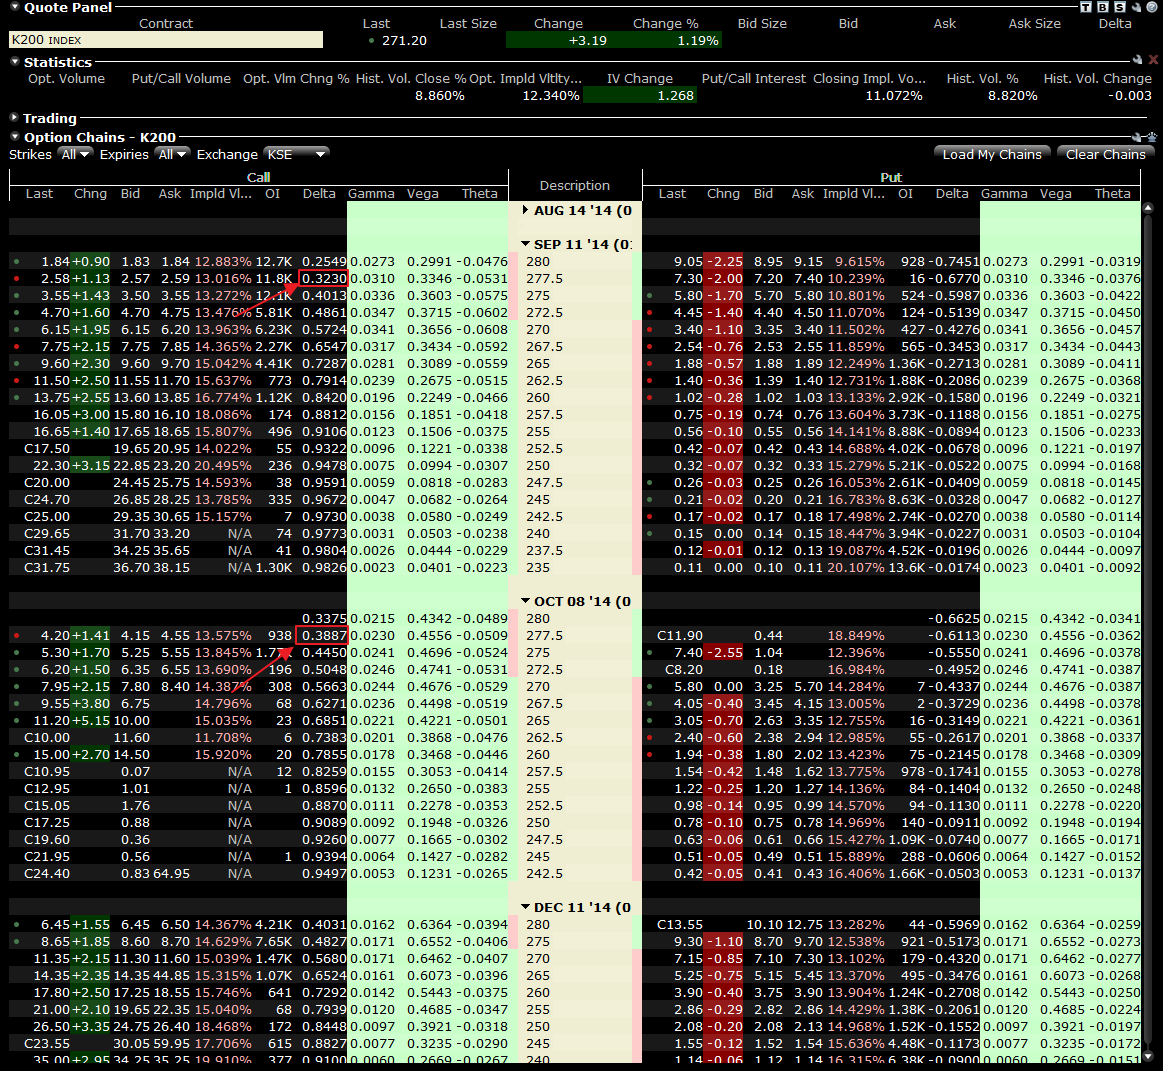
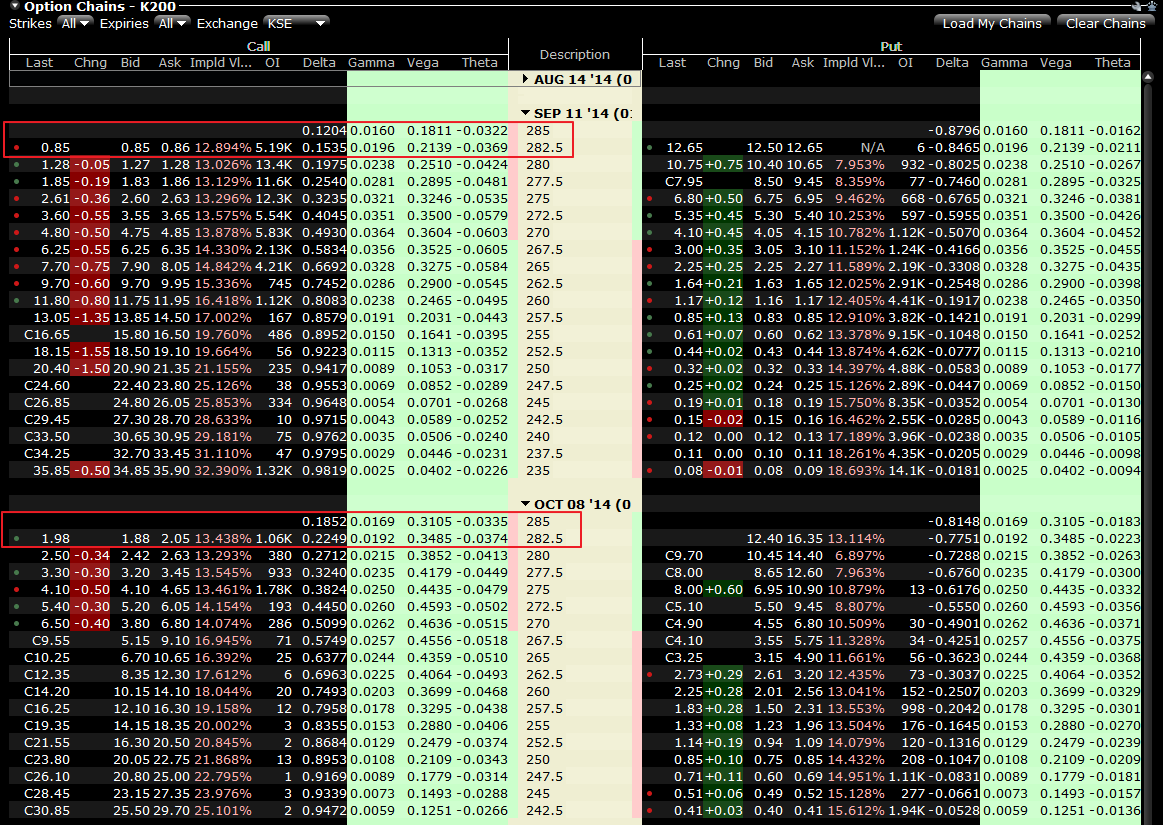
Although there are Bid/Ask price quoted for Call 282.5, somehow the Call Spread 280/282.5 price is not quoted or available for both Sep11'14 and Oct08'14.


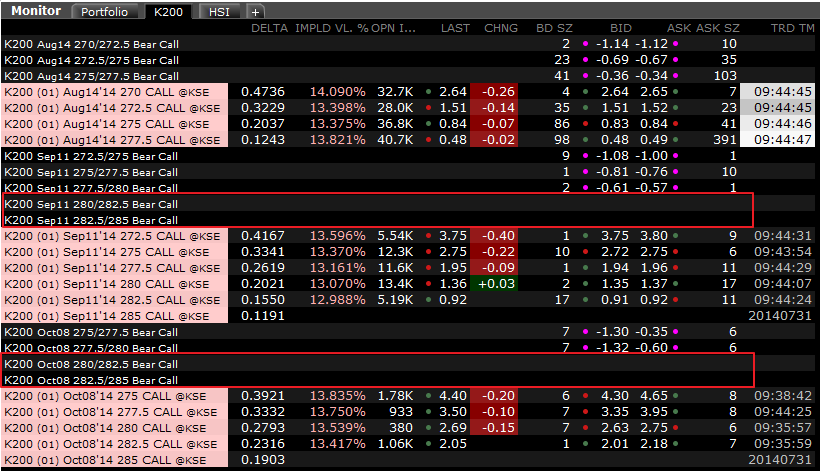
While technically you can execute one leg at a time separately,  this is not the Spead you want to roll up if you are having Call Spread 277.5/280.  If you do that, you will actually changing your 277.5/280 Call Spread to 277.5/282.5.  From a 2.5pt spread to 5.0pt spread.  Your short strike remain at 277.5.  This does not improve the risk.

The next closest spread you should roll up to is 282.5/285 Call Spread (if you are holding 277.5/285 Call Spread).  However, since price is not quoted/available for 285 Call Spread, you cannot even execute the leg separately.

SPX drop almost 40 points (2%)

S&P 500 (SPX) dropped almost 40 points (39.40), 2% on 31-July.  There are only 4 such big drop in 2014:

  1. 24-Jan (38.17 points)
  2. 3-Feb (40.70)
  3. 10-Apr (39.35)
  4. 31-Jul (39.40)

Tuesday, July 29, 2014

K200 Options cannot be defended

K200 close at 268.01 on Tuesday, 29-Jul, up 4.54 points in 2 days.  While I have expected it to move to 267-268 range, I didn't expect it to move so fast.


As at Wenesday, 30-Jul, 12.38pm Korea Time,  it move up another 3.12 points to 271.13.


Refer the Option Chain below:


Say, you have a Bear Call spread of Sep11'14 277.5/280.  Your short 277.5 Call is still about 6 points away but its Delta is 0.3230.  It is a basic rule to defend/adjust your Credit Spread when the Short Strike Delta is above 0.25-0.30.  A normal defending strategy (adjustment) will be roll out or roll up or both.

Firstly, you cannot roll up!  There is no Strikes beyond 280.  You cannot even roll up to 282.5/285 which is the nearest Spread you can roll up.

Secondly, you also cannot roll out!  To roll out, basically you will roll to next month with the same Strikes.  But you cannot roll out to Oct08'14 277.5/280!  There is no price available for 280 Call.  Even if 280 Call price is available, you might not want to just roll out as Oct08'14 277.5 Call is having a Delta 0.3887, higher than Sep11'14.  You won't want to roll out to a higher Delta.

Lastly, typically, we will roll out and up.  But, obviously,  you cannot roll out and up.  There is no Strikes higher than 280 in Oct08'14!

This is a serious limitation in trading K200 Options.  Looks like the only strategy is close the position and cut loss.


Saturday, July 26, 2014

Weekly Market Reivew HSI

HSI closed at 24,216.01 on Friday, 25-Jul-2014, gained 761.22 (3.25%) over the last 5 trading days.


Looking at the Weekly chart, what a long green bar!.  HSI didn't just cross 24,000.  It beat the previous high and end the week wtih a higher high. 


From Monthly chart, Friday close is the highest for past 3 years!  The next target is 25,000.  If HSI break 25,000, it will be the highest since the low in 2009.

Weekly Market Reivew K200

K200 closed at 263.47 on Friday, 25-Jul-2014, gained 1.81 (0.69%) over the last 5 trading days.


While this week ended with a higher high, the climb for whole week is only 1.81 (0.69%).  Is it losing strength?  Or is it consolidating strength for the next push/jump?


Looking at bigger picture, if we do another Fibonacci extension with the recent lower high and higher low, K200 just hit the 100% mark.  If base on past moves, this could be its turning point to go down.
However, if we ignore the previous lower high (since it didn't even touch 61.80%), then it still have room to go towards 267-268.  Let's see.


On the weekly chart, it looks like it will continue its uptrend move.  However, 264.50 seems to be a resistance.  Let's see if it can break next week.


Weekly Market Reivew N225

N225 closed at 15,457.87 on Friday, 25-Jul-2014, gained 242.16 (1.59%) over the last 4 trading days (N225 was closed on Monday).  NKVI moved down 0.6 (3.90%) ending the week at 14.78.


N225 still move in the range of 15,000 - 15,500.  It has been in this range for 5 weeks.  500 points range is a pretty tight range for N225.  We need it break away (up or down) this range to have a clearer idea where it is heading.


Looking at the bigger picture on daily chart, nothing much has changed.  While it is still in the tight range of 15,000 - 15,500, with very low, we get a higher low.  So, I am still bullish until the chart tells me otherwise.


On the Weekly chart, it is an inside bar.  It is telling the same message from the daily chart.  It is undecided (still inside bar).  It remains in the tight range of 15,000 - 15,000.  It has a higher low for every bar, for the last 5 bars.  We might just have to be patient and let the chart tells us where it is going.


NKVI stayed mostly flat, slight decline, throughout the 4 trading days.  This is in line with N225 not going anywhere too.  We just have to wait and see.


SPX closed at 1978.34, down 9.64 points on Friday.  N225 might follow with a down day, keeping it in the tight range of 15,000 - 15,500 when open on Monday.


Saturday, July 19, 2014

Weekly Market Reivew HSI

HSI closed at 23,454.79 on Friday, 18-Jul-2014, gained 221.34 (0.95%) over the last 5 trading days.


Looking at the Weekly chart, last 2 weeks are inside bars.  Nevertheless, it looks like in uptrend towards 24,000.


This seems to be a major resistance, especially from Monthly chart.


Weekly Market Reivew K200

K200 closed at 261.66 on Friday, 18-Jul-2014, gained 4.94 (1.92%) over the last 5 trading days.


This week is almost a straight line up except with a little drop on Friday, due to the MH17 crash.  In fact, it has recovered almost all the drop since open gap down.


Looking at bigger picture, K200 stop its small decline with a higher low.  It has also established an higher high on Thursday.  It might continue its climb towards 267.50/270.00.  Let's see.


On the weekly chart, it looks like it will continue its uptrend move.


Weekly Market Reivew N225

N225 closed at 15,215.71 on Friday, 18-Jul-2014, gained 51.67 (0.34%) over the last 5 days.  NKVI moved down 0.92 (5.64%) ending the week at 15.38.


It was mostly a UP days except on Friday.  The drop of 154.55 is mainly due to anxiety over the news of Malaysia Airline MH17 crash in Ukraine.  US & Europe indices plunge about 1% or more after the news.  Asia markets didn't seem to be affected as much.  While N225 is down 1.01%, K200 is down only 0.10% and HSI is down 0.28%.


Looking at the bigger picture on daily chart, nothing much has changed.  Despite the big drop on Friday, mainly due to the news, N225 is still above the previous higher low.  It is still above 15,000.


On the weekly chart, it is still an inside bar.  Nothing much has changed.


NKVI continue the decline to the lowest of 14, record low.  If not of the Friday drop, we might even see it going below 14.  This exceptional low volatility is getting more difficult to trade.  For now, just have to trade with caution.


SPX closed at 1978.22, up 20.10 points on Friday, recovered all the lost (-18.23 points) on Thursday.  However, it is an inside bar.  Baring nothing unusual on Monday, N225 should open higher on Tuesday (N225 will be closed for trading on Monday due to public holiday).


Saturday, July 12, 2014

Weekly Market Reivew HSI

I started to look at HSI this month to diversify, especially when N225 is having such a low volatility.  While I have written in this post that HSI is not as attractive as K200 (and N225), it nevertheless is another popular Asia index that I can trade in Asia hours.

HSI closed at 23,233.45 on Friday, 11-Jul-2014, lost 312.91 (1.33%) over the last 5 trading days.


HSI seems to be also in a period of low volatility, unfortunately.  The daily and weekly movement this month to date is rather small.

HSI Options Open Interest (OI) is very small as compare to N225 or K200 for future months, even for current+1 month (August).  You only see OI >1K contracts in July.


For K200, you can easily get >1K contracts in OI even for further month like September.


This might be a challenge for me as I don't usually trade the current month.  Will assess for 1 month.

Weekly Market Reivew K200

K200 closed at 256.72 on Friday, 11-Jul-2014, lost 3.91 (1.50%) over the last 5 trading days.


This week drop has all small body candles.  However, the day range is about average or slightly lower.


Looking at bigger picture, K200 stop its climb.  Unlike the previous few climb which hit above 76.40% or even 100%, this climb end below 61.80%.  Now, we got a lower high.  We need to see if it will have a lower low next week.


If we get further drop next week, such as below the trend line, then it might mean change of trend.  Let's see.


Weekly Market Reivew N225

N225 closed at 15,164.04 on Friday, 11-Jul-2014, lost 273.09 (1.77%) in almost straight line over the last 5 days.  NKVI moved up 0.7 (4.49%) ending the week at 16.30.


On the above line chart, this week drop looks bad as it is almost a straight line drop.  However, looking at the below candle chart, we actually have 3 green candles out of the 5 days.  While it open lower (gap down), it ended higher.  Most importantly, it still stay above 15,000.  Or am I bullish biased and reading too much into it?


Uptrend still looks intact, isn't it?


On the Weekly chart, it is an inside bar.  We might just have to wait to see what will happen next week.


NKVI manage to stop the decline and revert up a little.  There is nothing much I can/need to take action now except to continue monitor it.  If it ever display the same pattern as in 2012 (as mentioned in this post), I have to take the necessary actions.


SPX closed at 1967.57, up 2.89 points on Friday, stop (or pause?) the week decline.  N225 might stop the decline as well when open on Monday.


Sunday, July 6, 2014

Weekly Market Reivew K200

K200 closed at 260.63 on Friday, 4-Jul-2014, gained 1.85 (0.71%) over the last 5 trading days.


It seems that K200 short-term downtrend has stopped.  It is resuming its uptrend.  It had a higher high this week.  We might see it breaking another previous high before we get the higher low.


Looking at bigger picture, it is a nice retracement before K200 resumes its uptrend.  Using Fibonacci Extension, we could see K200 moving towards 267.50.