Saturday, April 26, 2014

Weekly Market Reivew K200

I wanted to do a similar weekly market review on K200 as N225.  However, I couldn't find a reliable chart after many problems with IB Charting on K200.  Korea Exchange also do have the same rich info as Osaka Exchange on their indexes.

This is the K200 1 week and 3 month Chart I got from Korea Exchange.


I think I will use Bloomberg for the time being, until I find something better.

K200 closed at 257.42 on Friday, 25-Apr-2014, lost 4.10 (1.57%) over the last 5 days.


What is more significant is the drop on Friday, 3.66 (1.40%) drop!  I was waiting for this drop for quite some time as K200 had been moving up and staying up despite how the rest of the world moved.


I believe K200 will get some support at around 257-258 zone, which it did on Friday.  However, with the bearish move on Friday and SPX drop of 15+ points on Friday, it is very likely that we see K200 move down pass 257.  Let's see if 257 will hold.


KOSPI 200 data feed problem again

In my previous post, KOSPI 200 data feed fixed, I mentioned that the K200 data feed problem has been fixed.  I have asked IB whether they will correct the data for the past 6 trading days.  Not only that they said they couldn't.  The problem is now even worst.

This is the Weekly Chart (because I cannot even show a useful daily chart).  The data between 23-Jul-2010 and 18-Apr-2011, 12-Oct-2012 and 7-Apr-2014 is lost!

I reported the problem on 9-Apr-2014, reminded them on 16th, 25th.  They have not responded since.  Probably don't know what/how to response.

Weekly Market Reivew N225

N225 closed at 14,429.26 on Friday, 25-Apr-2014, lost 87.01 (0.60%) over the last 5 days, up & down directionless.  NKVI moved down to 21.96 on last Friday, the lowest for the past 3 months.

In last week review, I mentioned if we have a lower high, we may end with a lower low breaking the past low of 13750 or/and 13180.  N225 ended directionless this week.  If it goes lower in the coming week, this will be the lower high.  Let's see.


NKVI at 21.96 is the lowest for the past 3 months, with only 3 days in January were below 21.96.  Not a good time to sell options.

SPX close at 1863.40, big drop of 15.21 points (0.81%) on Friday would likely bring N225 down on Monday open.  Volatility should also go up a bit.


Saturday, April 19, 2014

Weekly Market Reivew N225

N225 closed at 14,516.27 on Friday, 18-Apr-2014, gained 556.22 (3.98%) over the last 5 days.  NKVI moved down to 22.50 on last Friday, almost the lowest for the past 3 months.


In last week review, I thought, with the SPX loss of 17.39 points, N225 might test the 13750 low in October 2013 on Monday.  It didn't get close to it.  The low was 13885.22.  So, N225 is now back to the middle of 14000-15320 range.

However, if you look at the 3 months chart, N225 has lower high in early April and reach a lower low on this Monday.  If it reach another lower high, breaking 13750 or/and 13180 is very possible.

NKVI at 22.50 is almost at the lowest range of 20-30 for the past 3 months, with only 6 days in January were below 22.50.  Not a good time to sell options.


SPX close on Friday, 18-Apr-2014 due to Good Friday holiday.  N225 will be on its own on Monday, not taking any clue from SPX.


Interactive Brokers N225 Index Charts

Can't help but another rant on Interactive Brokers (IB), especially I am spending my Sunday morning doing review.

This is N225 Daily, Weekly and Monthly Charts from IB.  There was a spike on 26-Sep-2013 that send N225 to a high of 38,311.34!!!


I reported the problem to IB.  This is the few replies I got:
At times, a chart may contain outlier data figures which may skew the overall presentation of your layout. To remove such, please right click on the bar and select remove bar. 
RegardsInteractive Brokers.
IB receives our data from our data provider and we do not provide any guarantee of accuracy. What we do offer however is the ability to remove any abnormal bars from your charting using the function mentioned previously so your graph would re-scale accordingly.
Regards
Interactive Brokers. 
IB provides data as is. Though we do not pre-filter data received, you may elect to either remove the obviously erroneous bar manually or have a custom filter to exclude such from your TWS. This setting is under your chart → Edit → Globa Chart Configuration. Look under Misc section, and specify your Bar/Line chart spike protection.
If above is not satisfactory response, you may elect to subscribe to required data from external sources.
Interactive Brokers. 

Does these even make sense for an obvious data error?


Problem In Combo Order Execution for K200 and N225

In my previous post Difficulty In Trading Combo Order for K200 and N225, I have described the difficulty of getting a good filled, such as at middle price.  I have kind of accepted to sell at the Bid and buy at the Ask, losing whatever in the spread.

To my horror, I couldn't even get filled when I want to sell at the Bid price.

Let me give you an example.  I was trying to close the K200 Call Bear Spread 272.5/275 by selling the spread.  As you can see from the below screenshot, there is a 2,453 contracts bidding to buy at -0.05.  I have a Limit order to sell 5 contracts at -0.05.


The limit order stay there and never get filled.  I submit this as a execution problem to Interactive Brokers (IB), this is the reply I got:

Please note that the condition for legging in a non-guaranteed combo order is the limit price must be at least 1 tick though the implied quotes. Since your order was just hitting (not through) the bid price, the combo order was not submitted. Please let us know if you have any further questions. Thank you.
Regards,IB Customer Service
OMG, the Bid price need to move to -0.04 before my Limit price -0.05 will get filled!  Does this even make sense at all?

I encounter the same problem with N225.  I submitted a problem ticket to IB.  I got exactly the same reply as above.

However, through more encounters, trial and error, I have a fix for the time being:

  • Cancel the Limit Order and Resubmit a new Limit Order.  

The Limit orders I had were mostly submitted before the Bid price meet my Limit price.  That is to say, I queue to sell at the Limit price, hopping the market price will reach my Limit price.  To fix this problem, all I have to do is to cancel the current Limit order and resubmit a new Limit order with Limit price equal to the same Bid price.

So, basically this means, I cannot queue for the price.  I can only stare at the screen and submit a Limit order to get the Bid price.  I didn't try submit a Market order.  I won't know what price IB will fill it for me.


Sunday, April 13, 2014

Weekly Market Reivew N225

N225 closed at 13,960.05 on Friday, 11-Apr-2014, loss 1103.72 (7.33%) over the last 5 days in a almost straight line down.  NKVI moved up to just above 25 on last Friday.

In last week review, I was worried that N225 continue to creep up past 15320.  It is good that it stop the creeping up.  But I didn't expect it to loss >1000 points in 1 week, breaking the past 2 months range of 14000-15320.  The next low is the 13750 in last October 2013, which could be broken on coming Monday, 14-Apr-2014.  Thereafter, it could challenge the low of 13180 on last end August 2013.

If it ever go that low, we could be seeing NKVI move above 30 like last Aug/Sep 2013.

SPX big drop of 17.39 points (0.95%) last Friday would likely bring N225 down on Monday open, testing 13750.  Volatility should also go up a bit.


Interactive Brokers US Index data/chart problem

Really, really frustrated with Interactive Brokers (IB) market data problem.  We are not talking about individual stock market data.  We are talking about the 2 major Indices : S&P 500 and Dow Jones Industrial Average.  Russell 2000 and Nasdaq happen to be correct.

S&P 500
This is what taken from CBOE.  SPX close at 1815.69, down 17.39 (0.95%)


This is from Think Or Swim (TOS).  SPX closed at 1815.69, down 17.39 (0.95%).  OHLC match CBOE.
This is taken from IB on Saturday, 12-Apr-14 Singapore Time.  SPX last 1817.23 (based on IB calculated value, else no value), down 15.85 (0.86%).
IB calculated value


IB Native Index Prices


This is taken from IB on Sunday, 13-Apr-14 Singapore Time.  Because I got difficultly logining to IB the whole Saturday, I have to continue updating this post on Sunday.  So, I happen to capture this value again on Sunday.  I seriously don't know what IB is doing.  Why is SPX and INDU (Dow Jones Industrial Average) showing a positive change (i.e. up) instead of negative change (i.e. down)???


Dow Jones Industrial Average
THis is taken from Bloomberg


This is from Think Or Swim (TOS).  DOW closed at 16026.75, down 143.47 (0.89%).  OHLC match Bloomberg.

This is from TradeStation (TSS).  DOW closed at 16026.75, down 143.47 (0.89%).  OHLC match Bloomberg.


This is from IB.  DOW last at 16040.90 (but if you read the bar details, close is 16026.80), up 14.20 (0.09%).  OHLC DIDN'T match Bloomberg.


Many candles are not correct.  The last candle has such a long stick (arrow pointing) which TOS or TS chart do not have.

I really hope I can spend more time on the learning of trading option than struggling through the various problems, frustration I face with my broker, specifically IB.


Sunday, April 6, 2014

Weekly Market Reivew N225

N225 has gained 367.74 (2.50%) over the last 5 days in a almost straight line up.  NKVI was almost flat at about 24 over the last 5 days.  This is not a good situation for Iron Condor seller.  As the underlying creep up slowly towards the Short Call strike price, it will be very difficult to adjust with such a low volatility.


Looking at the 6 months data, after breaking down from about 16320 in end December, N225 has been in the range of 14000-15320 in the past 2 months.  The break above 15320 will get it out of this range bound.

NKVI has been in the 20-30 range for past 6 months, with only spike above 30 in February when N225 went down to 14000.


SPX big drop of 23.68 points (1.25%) last Friday would likely bring N225 down on Monday open, bringing it back to the range.  Volatility might goes up a bit.


Saturday, April 5, 2014

Option Greeks: VEGA

Since my main trading strategy is to sell Out of The Money (OTM) Credit Spread, as specified in my Trading Plan, the second Greek that I want to talk about is Vega.

OTM Options contains only Extrinsic Value.  There are 4 factors that determine Extrinsic Value:

  1. Time left to expiration (Theta)
  2. Volatility of the underlying stock (Vega)
  3. Changes in interest rate (Rho)
  4. Dividends of the underlying stock

Besides Theta, Vega is the second greatest influence on Extrinsic Value.  Interest rate and dividend are relatively insignificant.

Vega is an estimate of how much the theoretical value of an option will change when Implied Volatility (IV) changes 1%.  An increase in IV will increase an option's price, a decrease of IV would decrease an option's price.

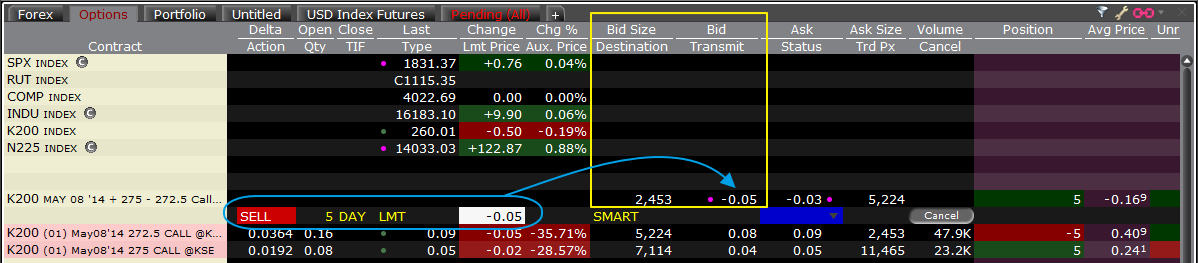
Vega is expressed as a positive number in Option Chain.  And there is only 1 Vega value for both Calls and Puts at the same Strike Price.  See image below.


Thus, a 1% increase in IV would increase both the Calls and Puts option by the Vega value.  While all Calls and Puts has positive Vega, your position can have either negative or positive Vega.

Vega and the position in the market:

  • Long Calls and Long Puts always have positive Vega
  • Short Calls and Short Puts always have negative Vega
When you Long an option (Calls or Puts) say at $1.00, with Vega say at 0.10, your option will be $1.10 when IV increase by 1% (assuming there is no move in the stock price and Theta is 0). 

When you Short an option (Calls or Puts) say at $1.00, with Vega say at 0.10, your option will be $1.10 when IV increase by 1% (assuming there is no move in the stock price and Theta is 0).  While the option price increase by 0.10, your Short position actually lose value by 0.10.  That is the reason why Short Calls and Short Puts always have negative Vega.

When you have a Spread, you have both a Short options and a Long options.  Take for example, the N225 May08'14 +16250 -16000 Call Bear Spread in the diagram below.


                                               Vega
N225 Jun12'14 16000 Call    12.7140
N225 Jun12'14 16250 Call    10.1607

While both of the Call options (16000 and 16250) are having positive Vega, the Call Bear Spread is having a negative Vega.  This is because in Call Bear Spread, you Short 16000 Call and Long 16250 Call.  The Short 16000 Call will have a negative Vega and the Long 16250 Call will have positive Vega.

-12.7140 + 10.1607 = -2.5533

Thus, the Call Bear Spread is in fact having a negative Vega of -2.5533, as indicated in the Quote Panel above.  The Call Bear Spread position will lose 2.5533 value if IV increase by 1% (assuming there is no move in the stock price and Theta is 0). 

Let's put both Theta and Vega together to see the impact to this Call Bear Spread.  
  • Vega is -2.5533
  • Theta is  0.8185 

IV increase by 1%
If IV increase by 1%, the Call Bear Spread will lose 1.7348 value after 1 day (assuming there is no move in the stock price).
  • -2.5533 + 0.8185 = -1.7348

IV decrease by 1%
If IV decrease by 1%, the Call Bear Spread will gain 3.3718 value after 1 day (assuming there is no move in the stock price).
  • 2.5533 + 0.8185 = 3.3718
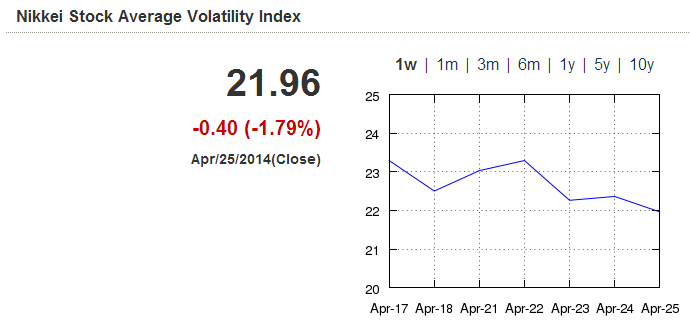
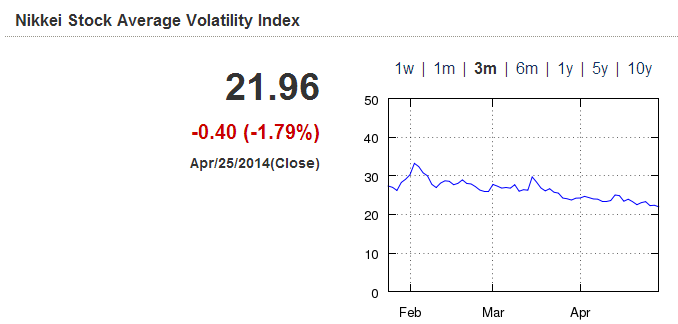
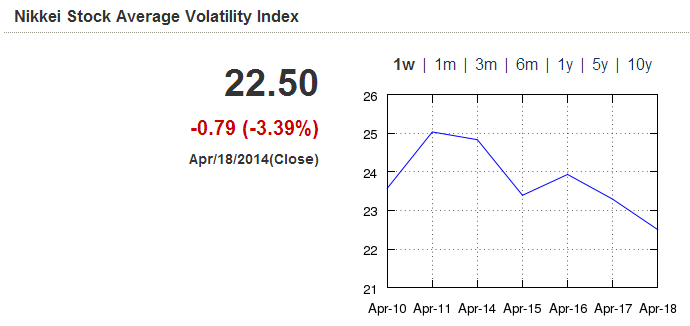
Therefore, there is an advantage to sell Credit Spread when the IV is high.  So, when IV drop from the high, the Credit Spread will gain value from both Vega and Theta.  However, if you sell Credit Spread when the IV is low, the increase IV will make the Credit Spread lose more value from Vega than the value gained from Theta.


Tuesday, April 1, 2014

Option Greeks: THETA

Since my main trading strategy is to sell Credit Spread, I will start with Theta, one of the Option Greeks.

Theta, a.k.a. time decay, is an estimate of how much the theoretical value of an option will decreases each day, assuming there is no move in either the stock price or volatility.

As mentioned in my previous post Selling Options, Time Decay is an unique feature in Options (not in Stock, Futures, Forex, etc).  All Options lose time value every day.  It loses time value at a faster rate as you get closer to the expiry date.

Theta is expressed as a negative number in Option Chain.  And there is only 1 Theta value for both Calls and Puts at the same Strike Price.  See image below.

Theta


While all Calls and Puts has negative Theta (they lose value each day), your position can have either negative or positive Theta.

Theta and the position in the market:

  • Long Calls and Long Puts always have negative Theta
  • Short Calls and Short Puts always have positive Theta

When you Long an option (Calls or Puts) say at $1.00, with Theta say at -0.10, your option will be $0.90 after 1 day (assuming there is no move in either the stock price or volatility).  Your Long position lose value by 0.10.  Thus, Long Calls and Long Puts always have negative Theta.  Remember all options lose time value very day.

When you Short an option (Calls or Puts) say at $1.00, with Theta say at -0.10, your option will be $0.90 after 1 day (assuming there is no move in either the stock price or volatility).  While the option price lose -0.10, your Short position actually gain value by 0.10.  That is the reason why Short Calls and Short Puts always have positive Theta.

It is not so straight forward when you have a Spread, where you have a Short options and a Long options.  Take for example, the N225 Jun12'14 +17500 -17250 Call Bear Spread in the diagram below.
Call Bear Spread


N225 Jun12'14 17250 Call   -1.8672
N225 Jun12'14 17500 Call   -1.5954

While both of the Call options (17250 and 17500) are having negative Theta, The Call Bear Spread is having a positive Theta.  This is because in Call Bear Spread you Short 17250 Call and Long 17500 Call.  The Short 17250 Call will have positive Theta and the Long 17500 Call will have negative Theta.

+1.8672 - 1.5954 = 0.2718

Thus, the Call Bear Spread is in fact having a positive Theta of 0.2718, as indicated in the Quote Panel above.  The Call Bear Spread position will gain 0.2718 value after 1 day (assuming there is no move in either the stock price or volatility).

For selling vertical spread (credit spread), we will always have positive Theta.  Our vertical spread (credit spread) will gain value slowly each day.


KOSPI 200 Volatility Index

As written in previous post, I was looking for VIX equivalent for Nikkei 225 (N225) and KOSPI 200 (K200).  I posted just a few days ago on the Nikkei Stock Average Volatility Index (NKVI) here.  Now, I am glad that I found VIX equivalent for K200: KOSPI 200 Volatility Index (VKOSPI) here.

Overview
Volatility index(VKOSPI) represents the volatility of the future(30-day maturity) KOSPI200 index as predicted by investors of the KOSPI200 option market based on the KOSPI200 option price. seving as the index to determine the market conditions and investment. It is used to manage (hedge) the market risk arising from the transaction of option and future derivative commodities Volatility index (VKOSPI) has been estimated and published since April 13.2009


Looking at the 6 month chart, VKOSPI usual range is between 12-15, with some spikes above 15 occasionally.  The only big spike is on 4-Feb-2014 to 17+ when K200 is at 245.30, lowest for the 6 months.
VKOSPI 6 month


The 3 months chart show that it stays between 12-15 most of the time, except the spike of 17+ in Feb.
VKOSPI 3 month


The 1 month chart show the same range of 12-15.  There are only 5 days that it is 14+.
VKOSPI 1 month


The 1 week chart shows that VKOSPI has been climbing up towards 14.  Probably is a good time to sell options, unless one is willing to wait till it goes over 14, which happens 5 times in the past month.
VKOSPI 1 week


Similarly, I will take some time to study VKOSPI with K200 to have a better understanding on the correlation before I update my Money Management rules in the Trading Plan.